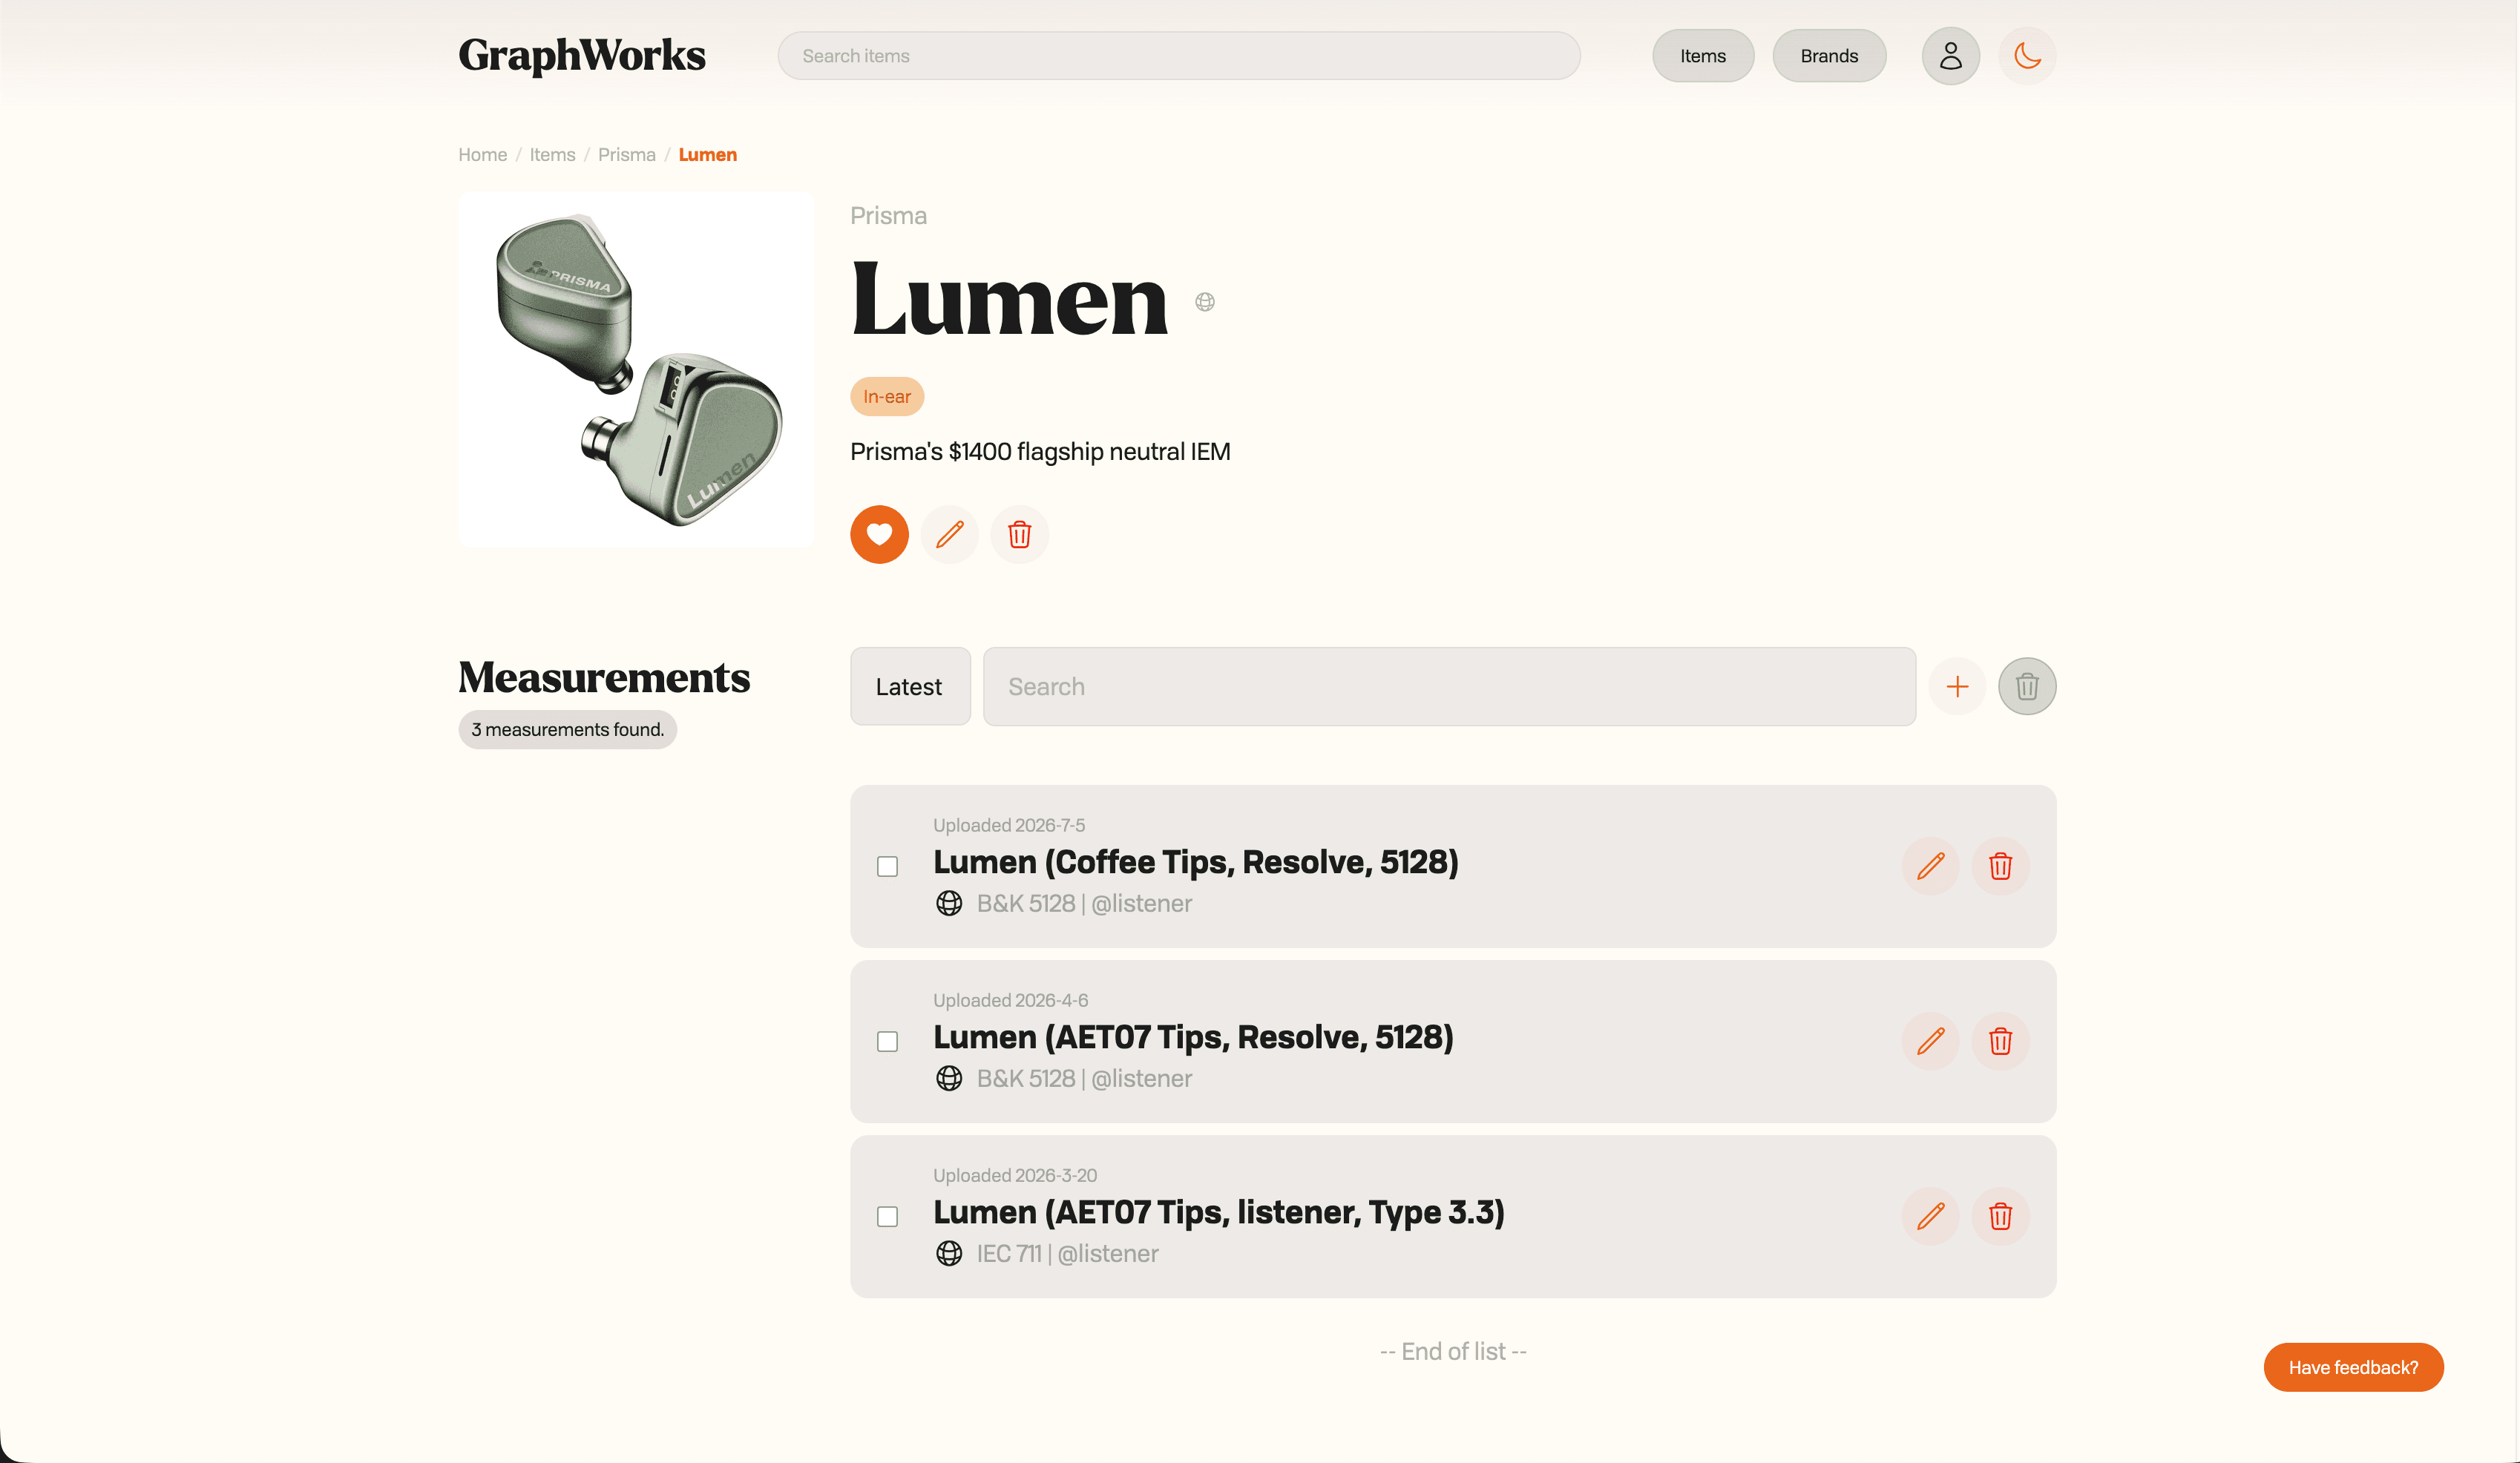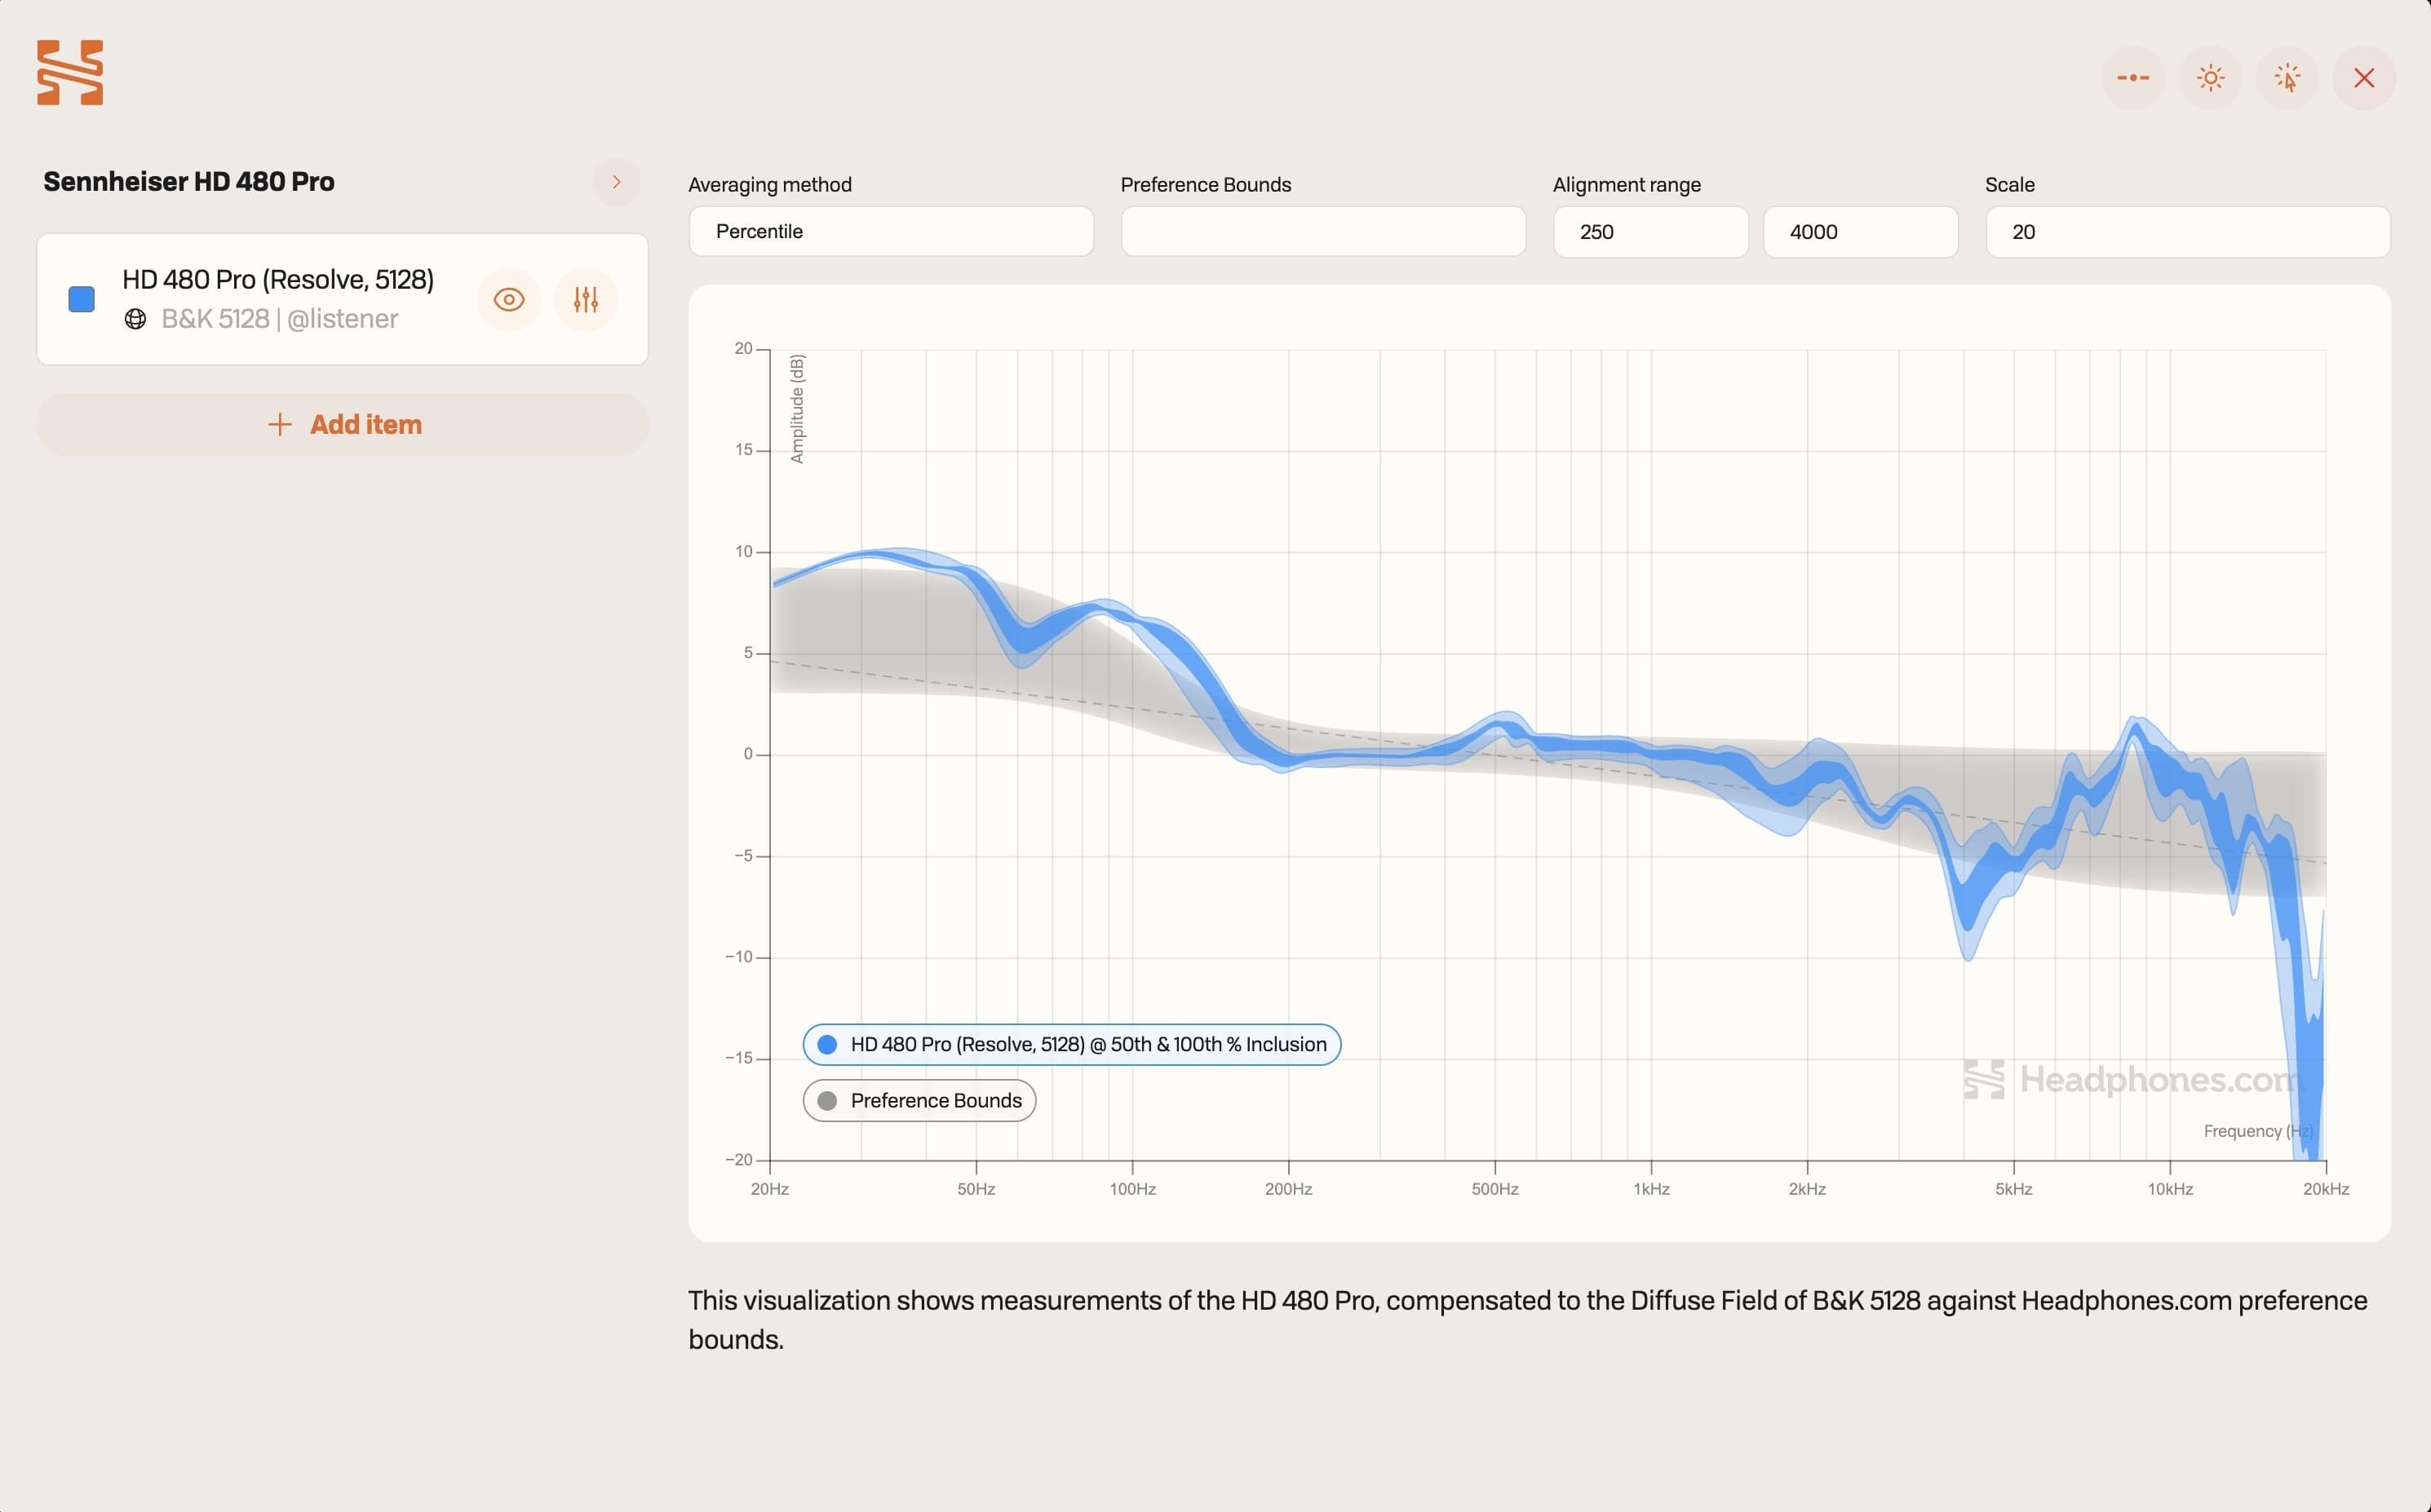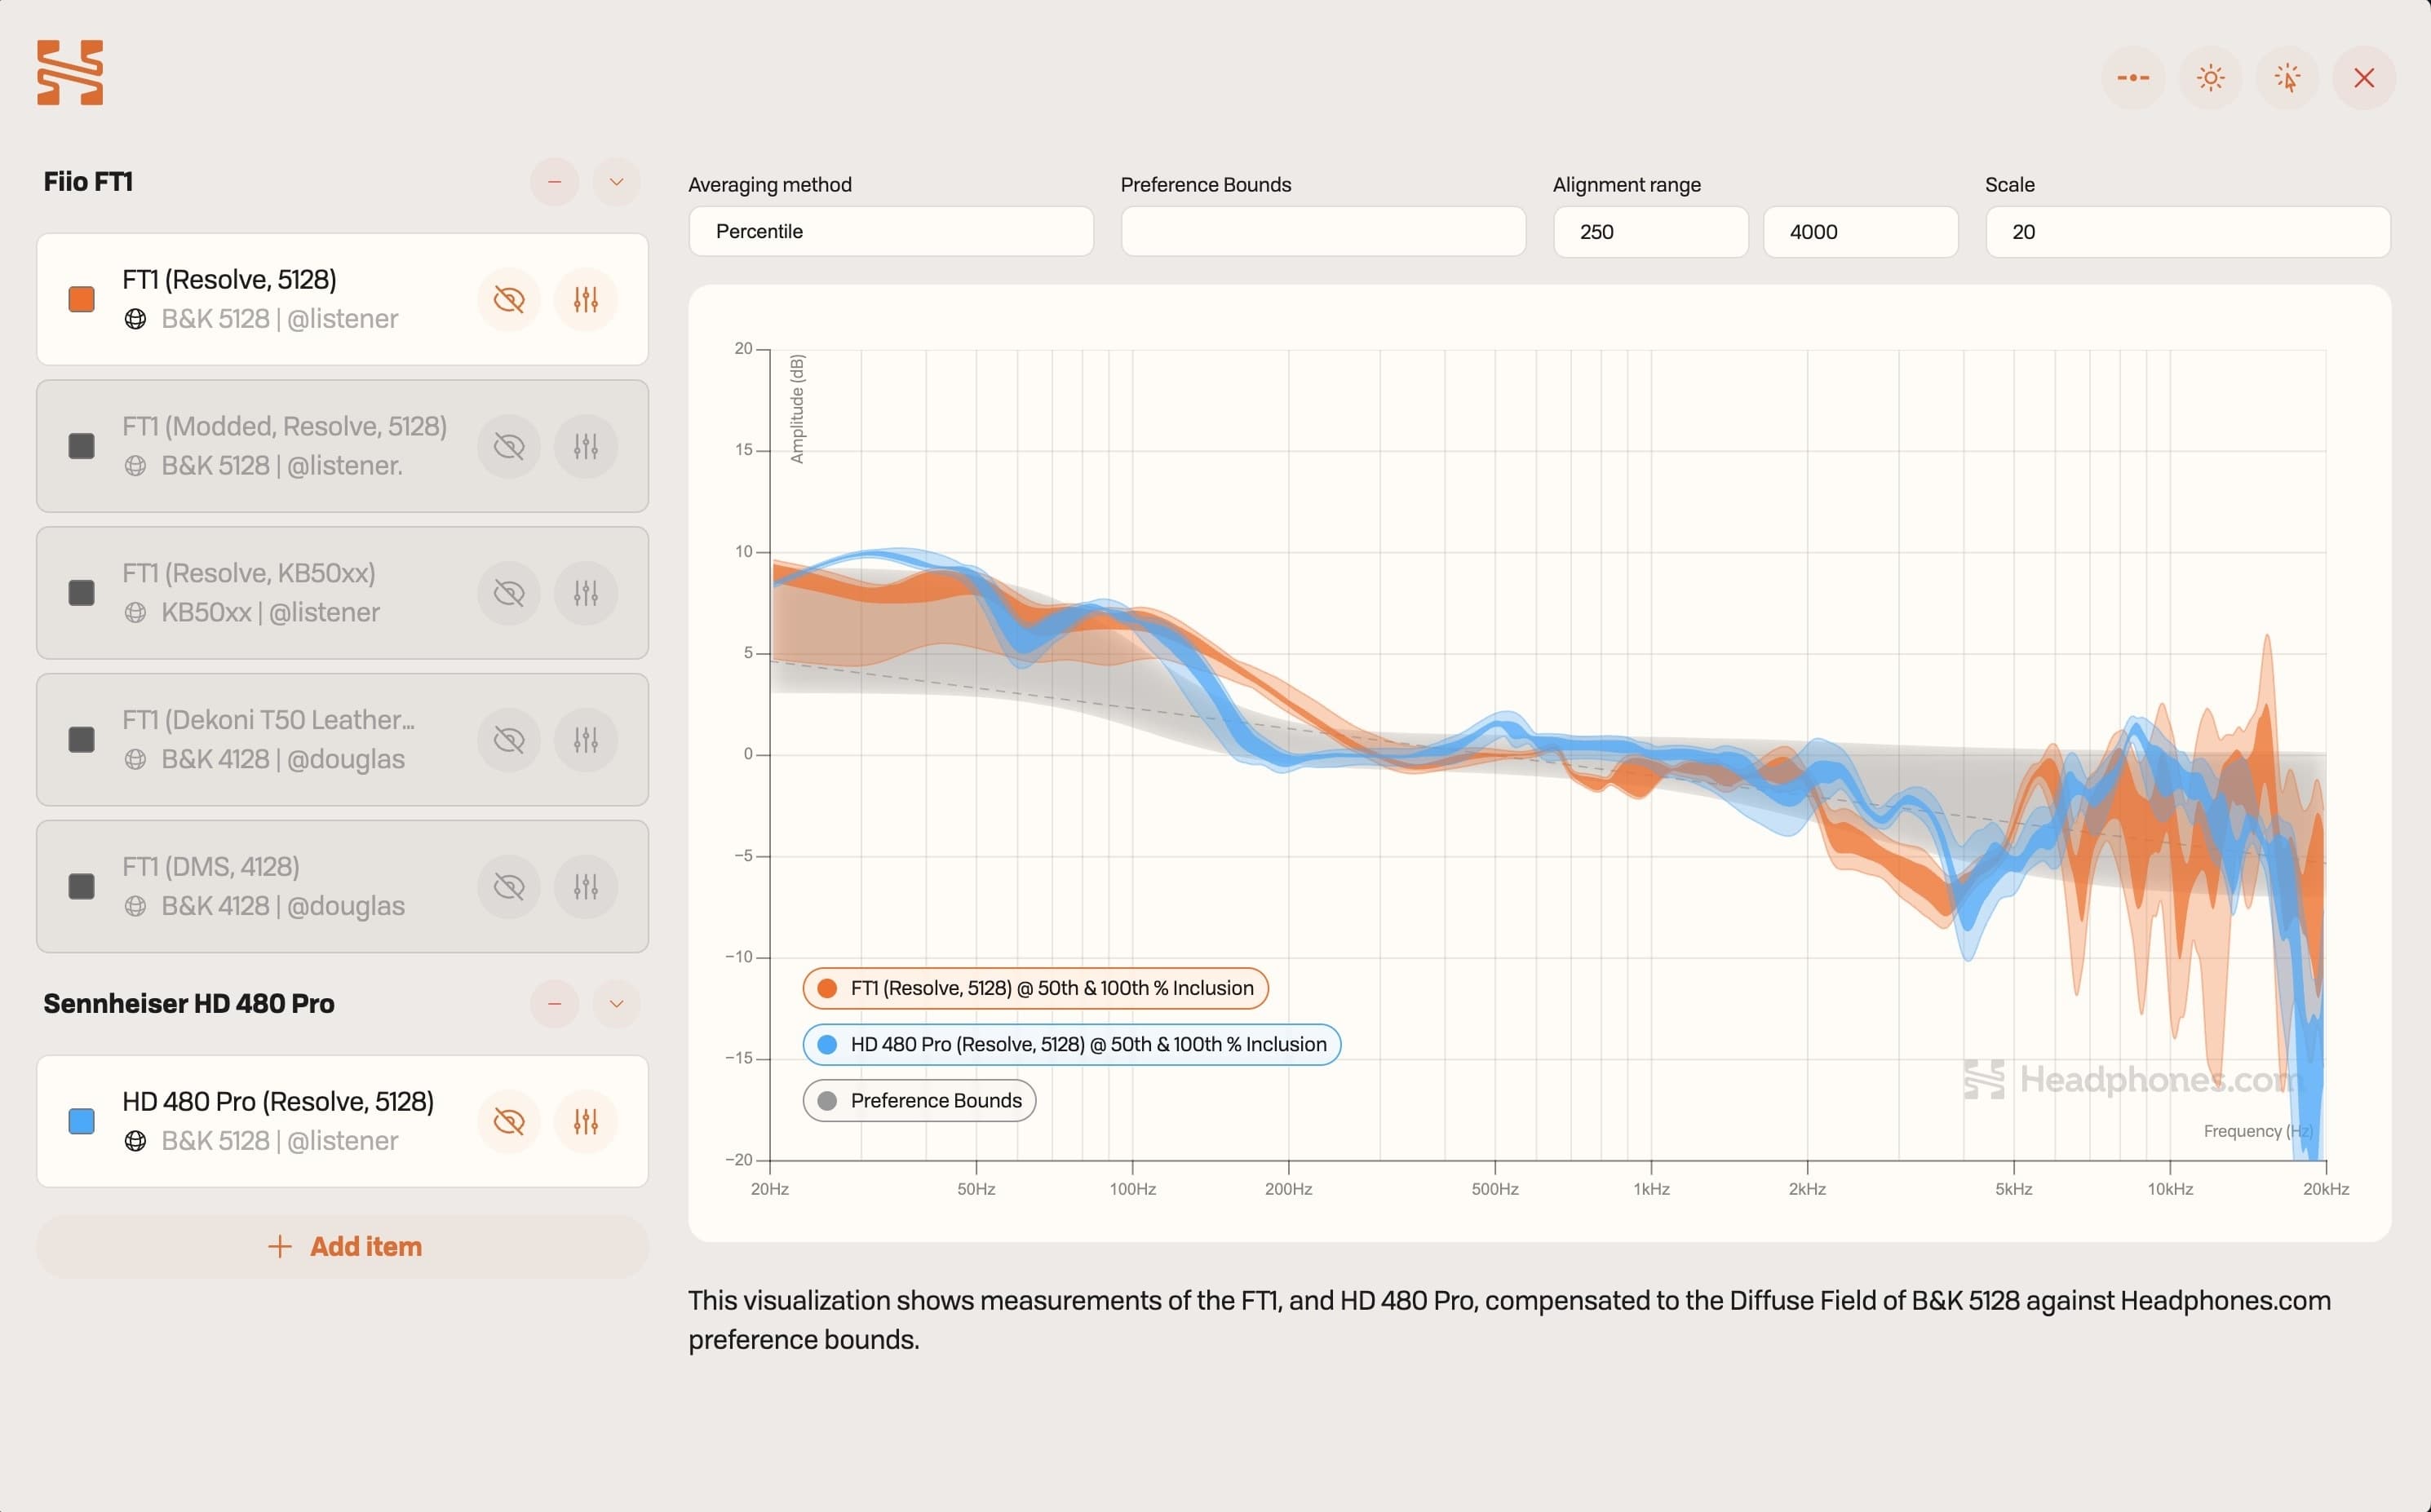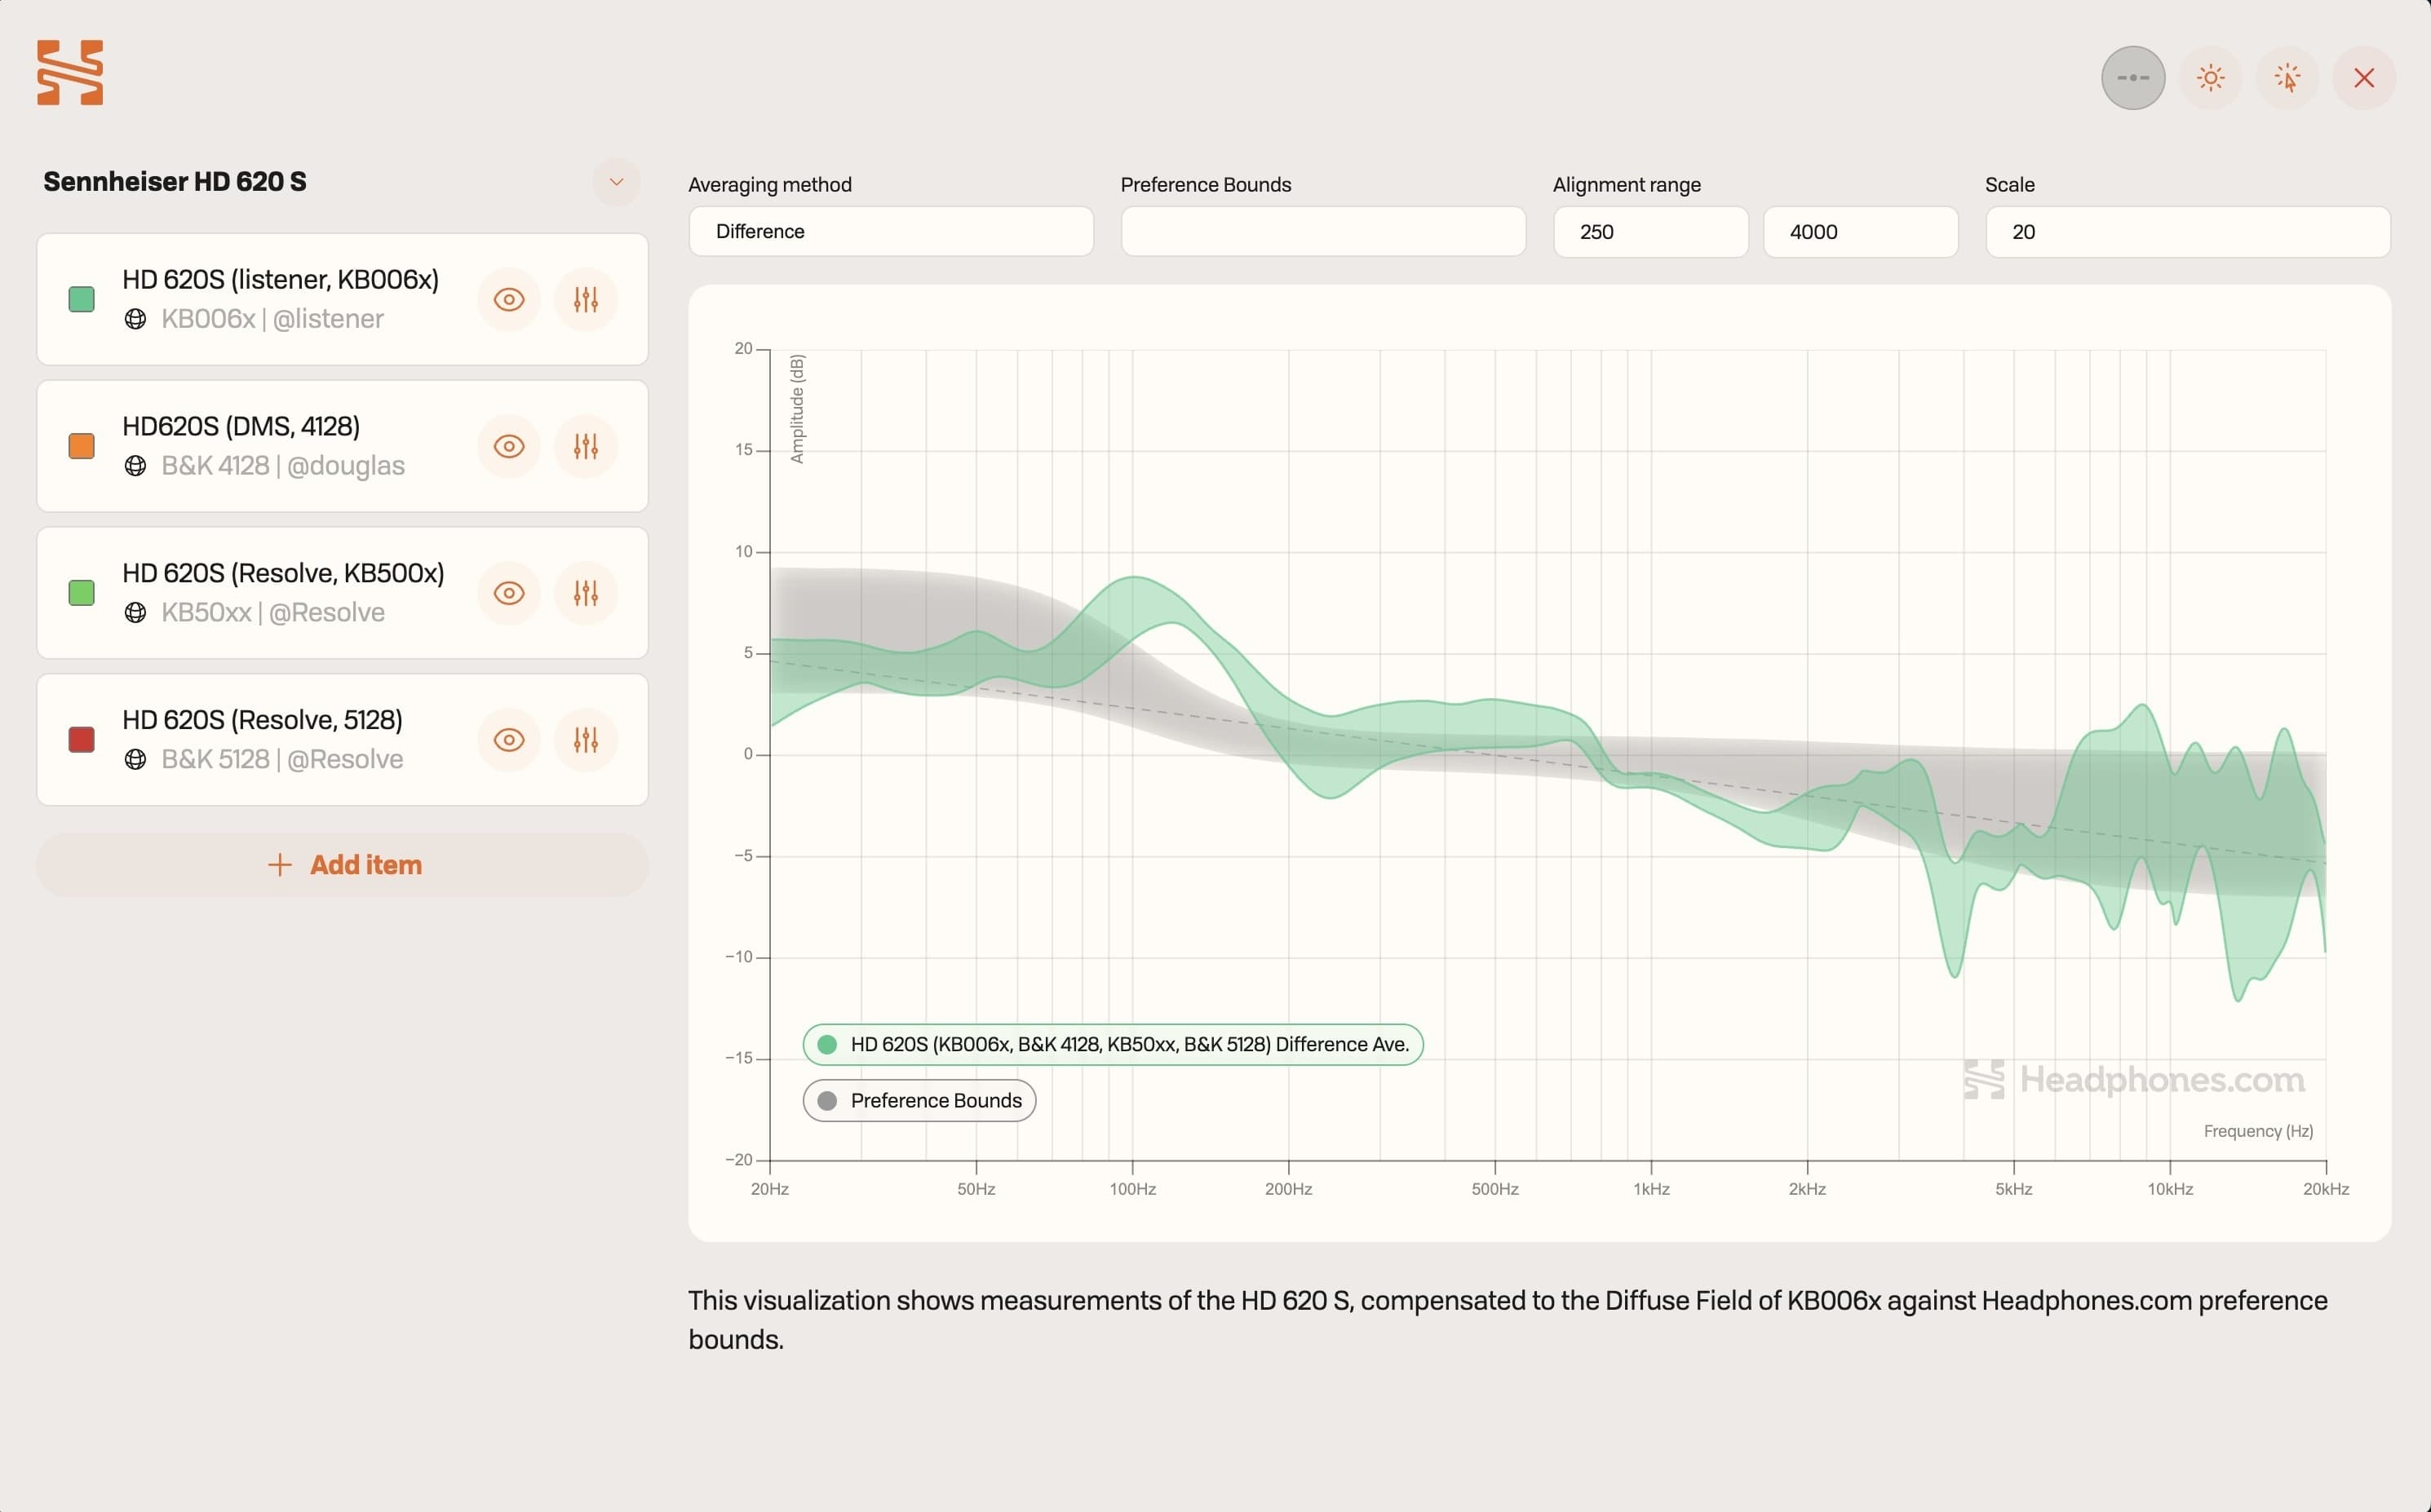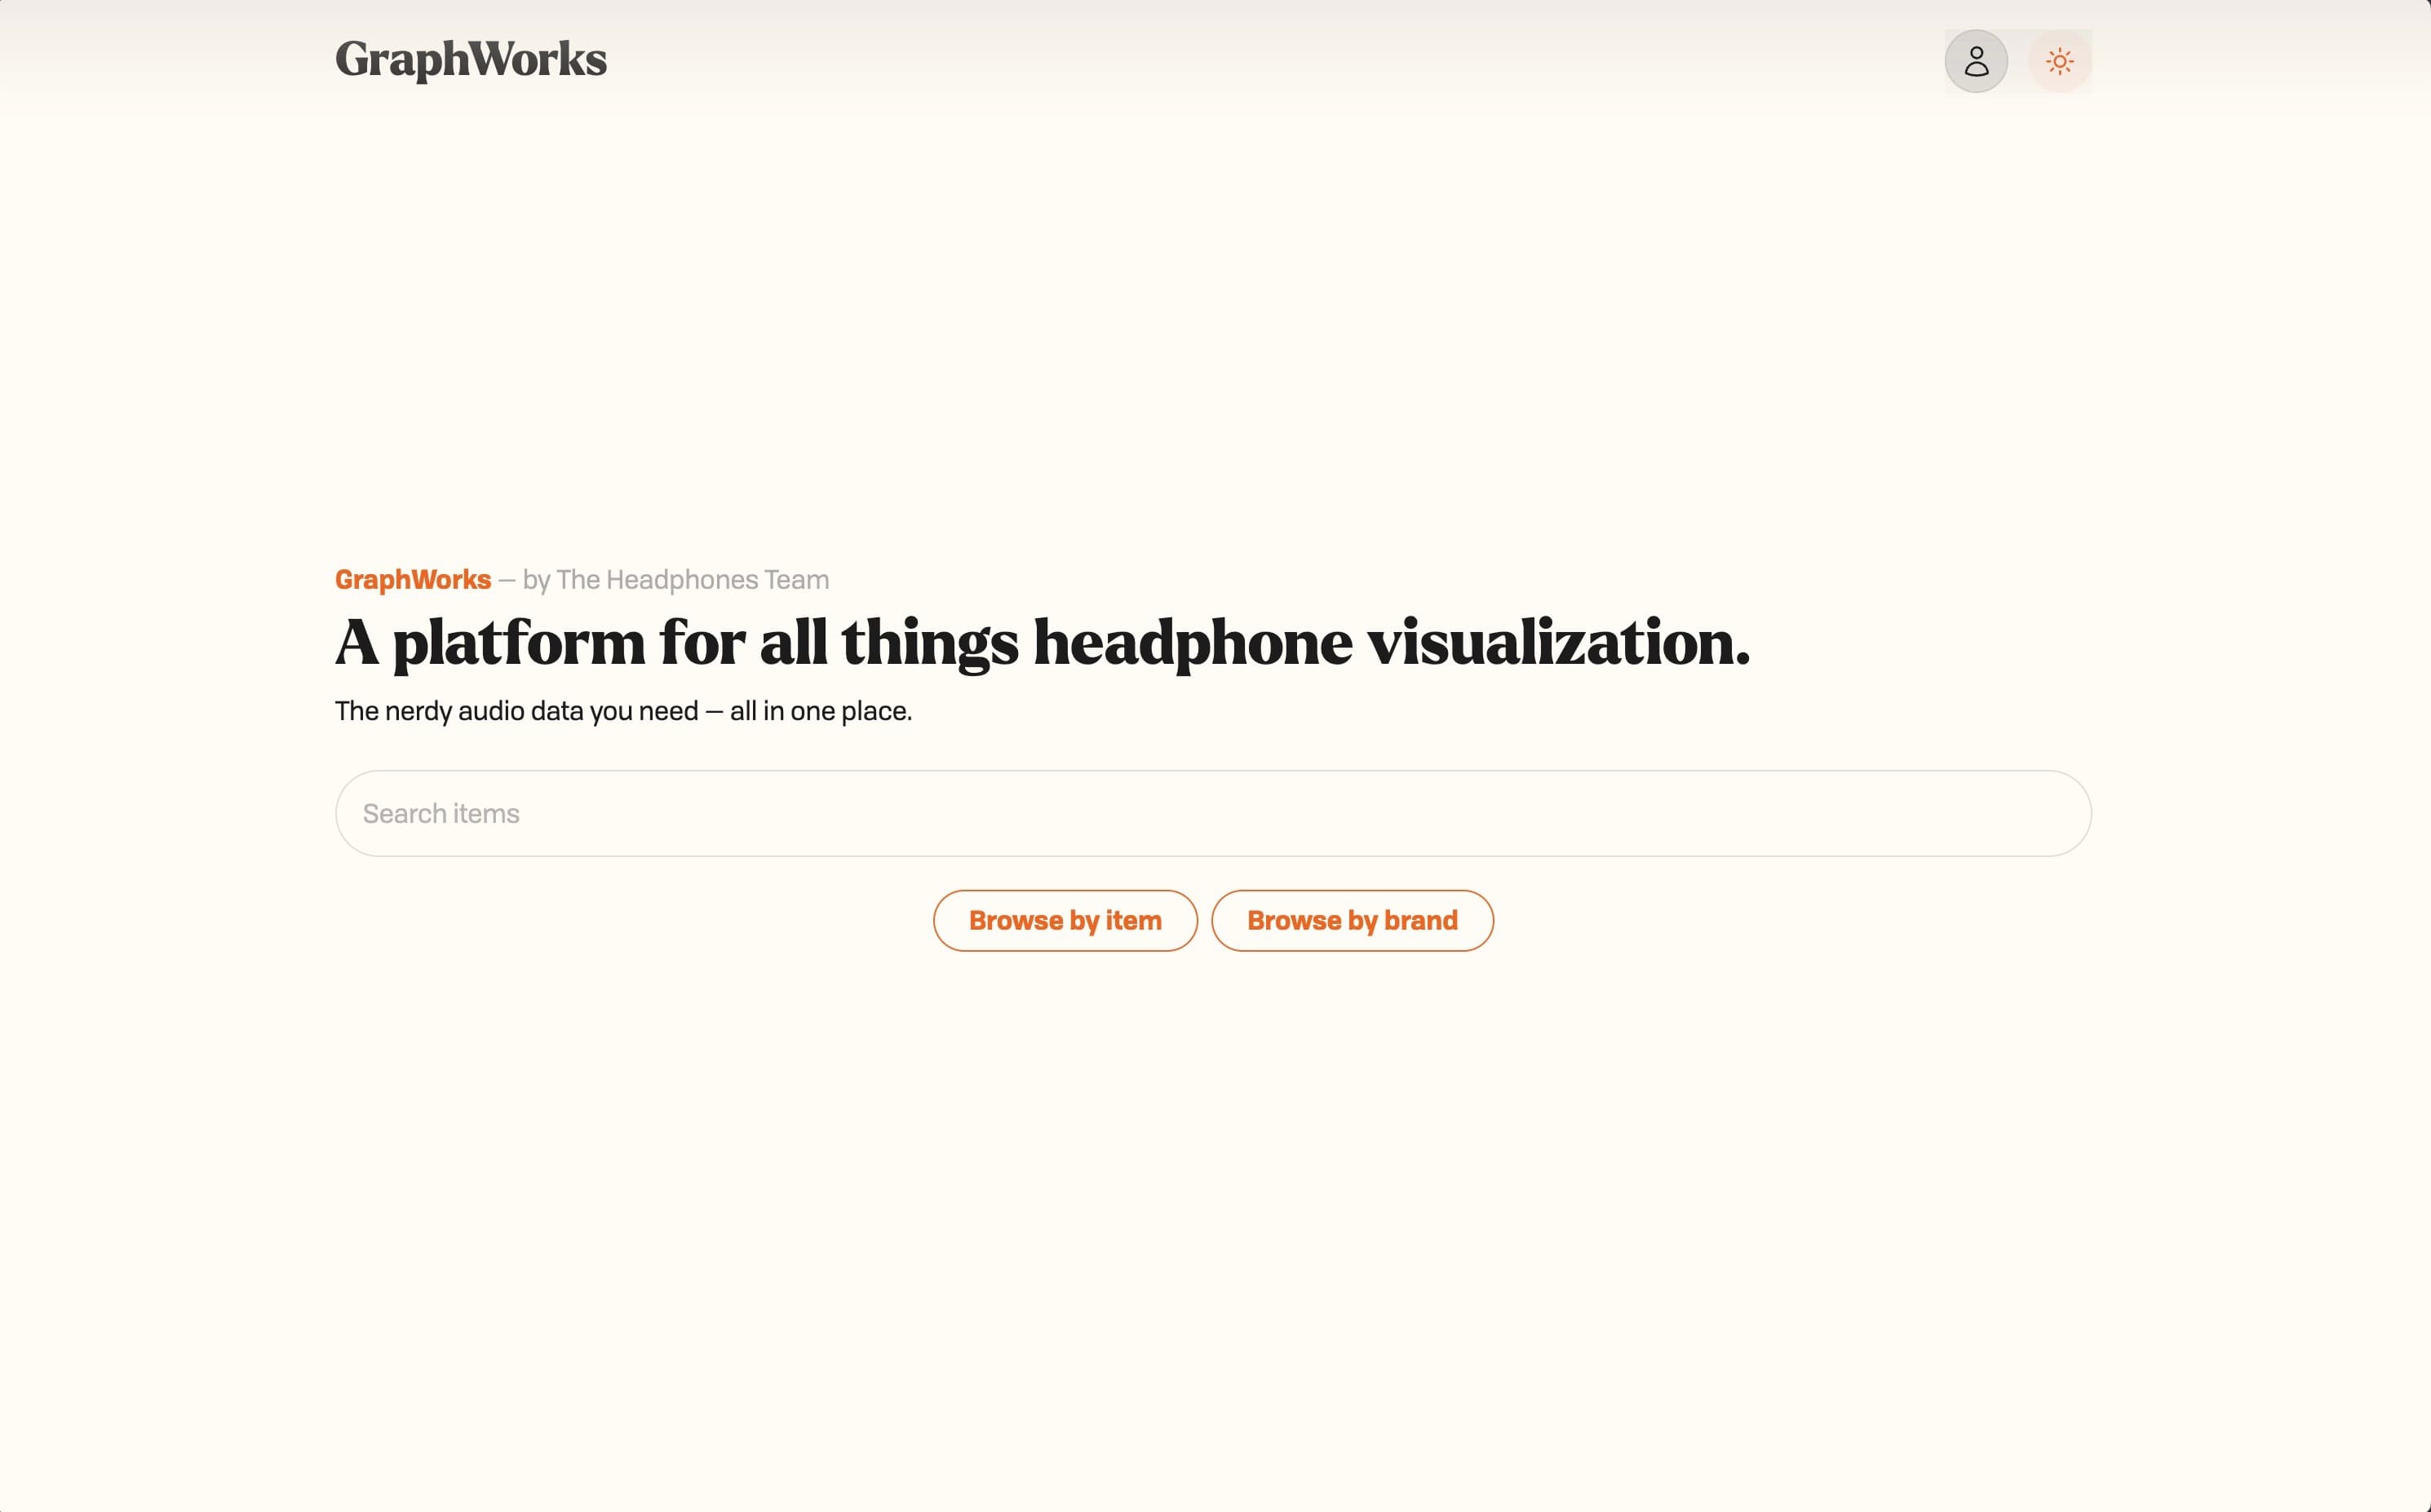
Working with the team at Headphones.com for a year and a half, we've recently launched GraphWorks — a platform for all things headphone visualization. It is — to date — one of the most collaborative and complex projects I've ever had the pleasure to work with.
GraphWorks was created initially as a way for the content team to easily export data visualizations of their headphone measurements in a number of more nuanced visualization techniques (i.e. sample percentile view, and rig difference view). After a while it quickly became apparent that the audio community would benefit greatly from accessing these measurements.
When I got to work on GraphWorks, there was already a working version in place. However, it had a few major problems: 1) query performance isn't ideal, 2) the current architecture isn't scalable, 3) scaling the UI is getting pretty hard as time goes on, and most crucially 4) the graph isn't behaving like it was supposed to.
The working version at that time had a slow response time, overkill data querying methods, messy graph functions, and un-necessary bloat. The unscalable architecture prevented us from putting in new features — particularly in the visualizer. So they tasked me to do the rewrite of the entire application.
GraphWorks was rewritten in Next.js, visx, Drizzle ORM — using PostgreSQL as our database, Better Auth, and Resend for emails. This architecture allowed us to add crucial features for the team such as: rig difference view, sample percentile view, optimized no-averaging view, preference bounds gradients, scalable component architecture, robust permissions system, and more. And it improved on search and data query performances.